Loading...
Reports & Analytics
Gain deep insights into your business performance with comprehensive reports and real-time analytics.
📊 Analytics Dashboard
The **Reports & Analytics** dashboard serves as your central command center for financial health and operational efficiency.
📈 Key Performance Indicators
Track vital metrics at a glance to understand daily performance:
- Total Sales: Gross revenue generated within the selected time period.
- Total Orders: The volume of successfully completed transactions.
- Avg Order Value: The average revenue per order.
🥧 Visualizations
Understand trends through intuitive charts like Best Selling Items and Orders by Type.
Detailed Reports
Select a tab below to view details about each report type:
The Dashboard gives you a quick snapshot of your restaurant’s core performance metrics in one place.
📊 Strategic Overview
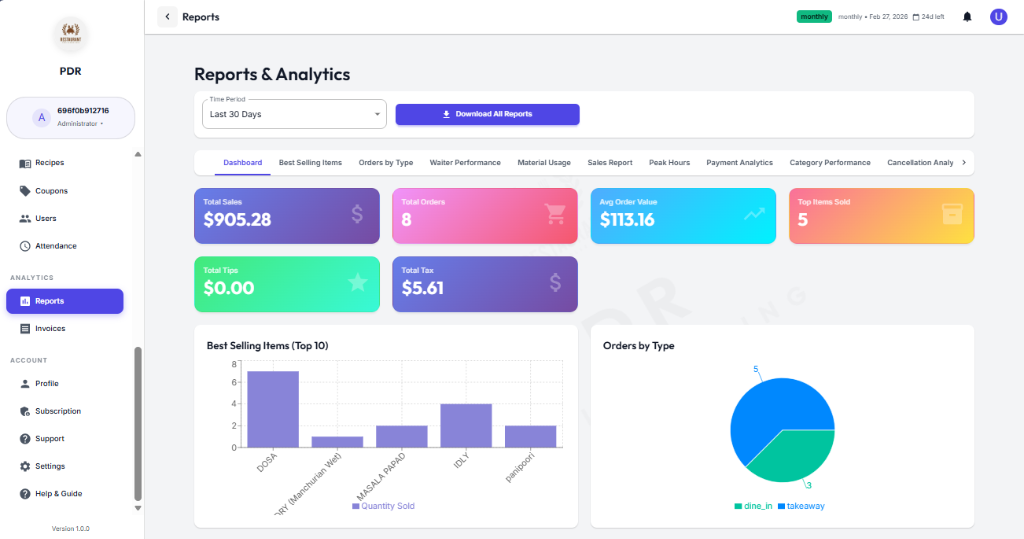
A simplified dashboard summary showing Total Sales, Total Orders, Avg Order Value, Top Items Sold, Total Tips, and Total Tax in one glance.
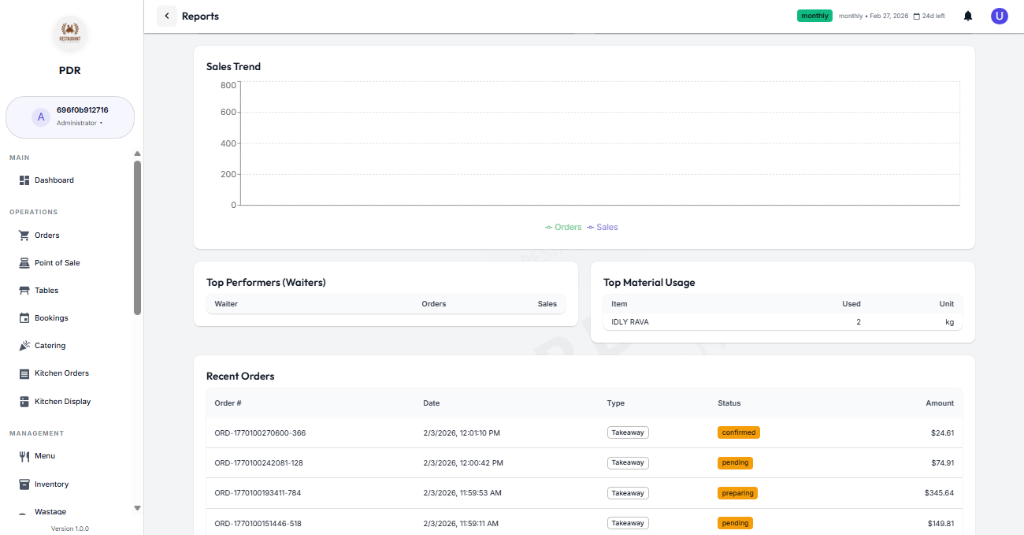
📈 Sales Trend
A dynamic line graph that tracks Orders and Sales over the selected time period. Use this to identify growth patterns and seasonal fluctuations.
🧑🍳 Top Performers (Waiters)
Monitor staff efficiency by viewing a leaderboard of waiters ranked by the total number of Orders handled and the Sales value generated.
📦 Top Material Usage
Keep an eye on inventory consumption. This table shows which raw materials (e.g., IDLY RAVA) are being used most frequently, helping in procurement planning.
📑 Recent Orders
A real-time list of the latest transactions. Each entry displays the Order #, Date/Time, Type (Takeaway/Dine-in), Status, and Amount.
💡 Pro Tip: Use the "Time Period" dropdown at the top of the actual reports page to filter data (e.g., "Last 30 Days").